Result Details tab
The Result Details tab displays a detailed (line-by-line) log of the test execution, which can be essential for test run analysis and debugging.
For each execution of an action line, the effect and/or test result is automatically recorded by TestArchitect. The line-by-line details are available for viewing in the Result Details tab.
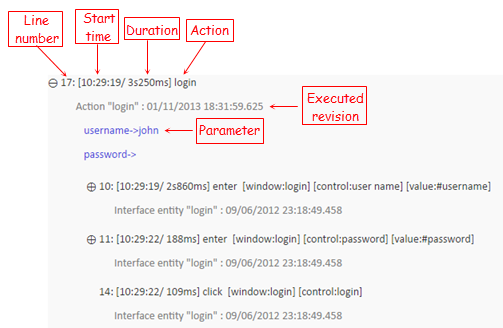
A result line consists of
- the line number in the file where the action was executed
- the action’s execution start time (if the Show Start Time & Run Duration option is enabled)
- duration of the action’s execution (if the Show Start Time & Run Duration option is enabled)
- the action name
- the action parameters (argument names and values)
- system messages, if any
- if Time-traveling execution is in effect) the executed revision(s) of any project item(s) invoked for the given action line.
Click  to expand and view additional details for each action’s results. Below is an example of the result details for the login action.
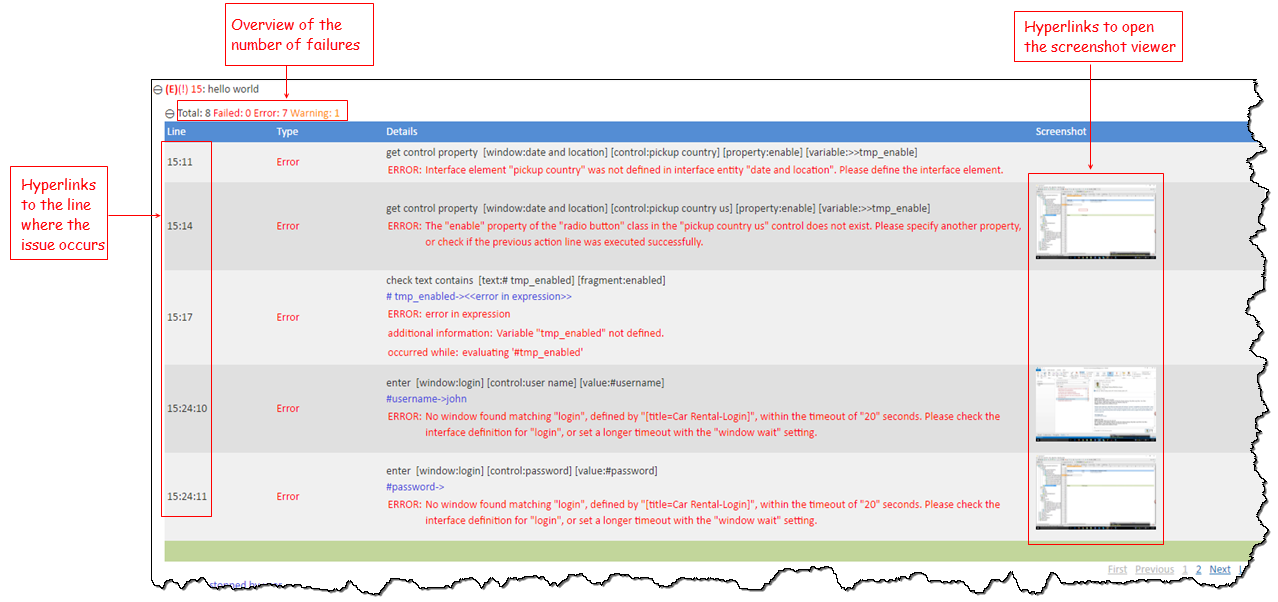
When a user-defined action, which calls other sub-actions, encounters failures during the test run, the respective number of failures are displayed underneath the action for quick references. Additionally, a Failure Summary table appears.

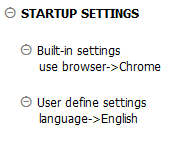
Table 1. Failure Summary tableField Description Line The line number in the test where the failure occurred. Clicking on the line number text navigates to the corresponding line in its execution context. Type The type of failure (Error, Warning, or Failed). Details Displays the action line that caused the failure, the proximate cause of the failure, and the system message, if any, associated with the failure. Screenshot Click the captured screenshots to launch the screenshot viewer to view the screenshots of UI-interacting actions. If you specified any startup settings at the start of the test run, and startup settings were enabled, the Startup Settings section is displayed at top of the page.

Additional functions
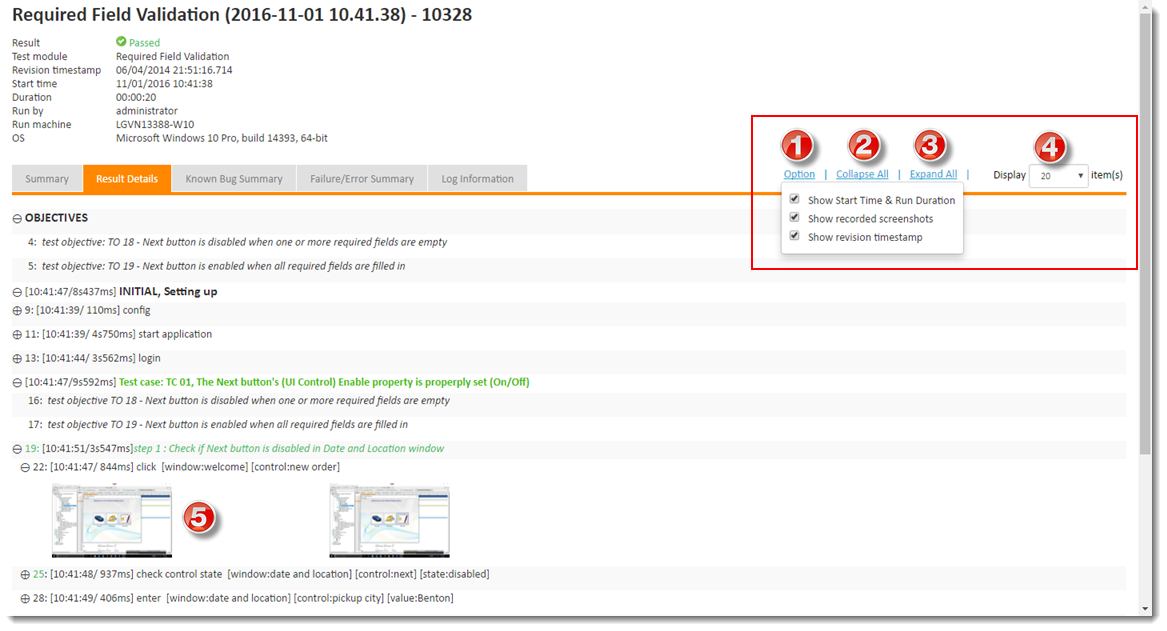
The Result Details tab also provide additional functions, such as, turning on the execution time reporting for all action lines, number of displayed action lines per page, collapsing/expanding all action lines, etc.
- Option:
Show Start Time & Run Duration: Display the start time and duration of each action’s execution.
Show recorded screenshots: Displays all logged screenshots captured during test automation. Note that TestArchitect captures screenshots only for UI-interacting actions, and posts to the local test result only those matching the specifications provided at the start of execution (in the Screen recording panel of the Execute Test dialog box).
Important:Recorded screenshots are only available to local test results. They are unavailable to repository test results. (Learn more.)Show revision timestamp: Display the executed revision of each project item involved, such as user-defined actions, interface entities, and data sets.
- Collapse all sections.
- Expand all sections.
- Change number of items displayed per page, such as,
20,25,30items, etc. - Click the captured screenshots to launch the screenshot viewer to view the screenshots of UI-interacting actions.
Related concepts
