Editing a heat map panel
Modifying a heat map’s appearance and/or the data used to generate it.
To edit the properties of a heat map panel on the Dashboard page:
Launch an instance of the Dashboard and log in to the session as a user with permission sufficient to edit a heat map panel.
On the Dashboard, go to the Dashboard page containing the heat map panel you want to edit and click Edit Panel
 .
.In the Edit Panel dialog box, change the panel settings on the Display Settings and Filters tabs as needed.
The panel settings on the Edit Panel dialog box are the same as the settings on the Add New Panel dialog box for reports (see Create new indicator panel) steps #3 through #4 with the following additional setting options:
- Height: Set the height (in pixels) of the panel. Taller panels have higher resolution, producing sharper charts.
- Folder: Select a TestArchitect repository folder containing the report data you want displayed in the new panel.
Optional: If the logged-in user is the owner of the panel being edited, select the Save current settings check box to permanently save the new settings, or clear that check box to not save the new settings, which causes the new settings to be discarded once the session expires.
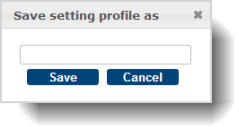
Notes:New panel settings are effective for the current Dashboard session whether or not the Save current settings check box is selected.Optional: After adding customized filters to the panel, if you want to save the new filtering expression(s) to a new data profile, click Save as on the Filters tab and enter the name of the data profile on the Save setting profile as text box, then click Save.

The Dashboard creates a new data profile based on the profile specified in the Data Profile drop-down list (on the Display Settings tab) with customized filters added. The logged-in user owns the newly created data profile, and this Dashboard panel uses this new profile.
Click OK to save the new panel settings.
Related concepts
Related tasks
Creating a heat map panel
