Filtering data
In this activity, you will restrict the items of data being used for a panel to those which matches a set of criteria that you define.
Before proceeding:
- Ensure that you have a basic understanding of the TestArchitect Dashboard before creating a chart panel.
- A Dashboard portal, connected to the Sample Repository, should be open in your browser.
- Ensure that you have created a Test Results (unfiltered) data profile as specified in the section Creating a data profileTutorial: Creating a data profile.
- You should also now have a Tutorial Page with the panel Car Rental Test Results Overview, as was created in the section Creating a chartTutorial: Creating a chart.
Our task now is to create a pie chart similar to the first, except that we limit it to reporting only on the test results of the latest build.
Create a clone of the Car Rental Test Results Overview panel.
Click the Clone Panel icon
 at the top-right corner of the Car Rental Test Results Overview panel.
In the Clone Panel dialog, select Tutorial Page from the Select page drop-down menu, and set Display Name to
Car Rental Test Results, Latest Build. Click OK.A new panel, identical to the first except for the display name, is created.
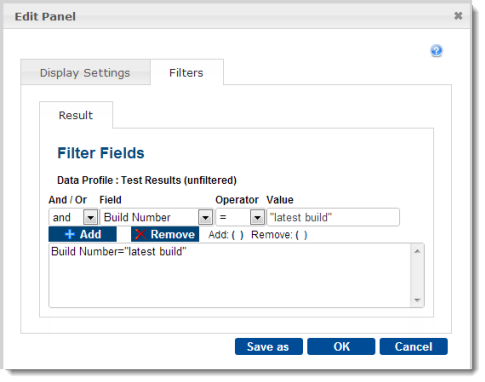
Add a filter to the new panel.
Click the Edit Panel icon
 at the top-right corner of the
 Car Rental Test Results, Latest Buildpanel.Click the Filters tab in the Edit Panel dialog.
In the Filters tab, create the filter by setting the following fields:

- Field: Build Number
- Operator: =
- Value: latest build
Click on the Display Settings tab.
- Notes:The Chart Title of
Summarized test results across test modules and datesno longer applies to this chart. Since we already have a name for the panel, let’s just make Chart Title invisible.Under Chart Settings, clear the Show Title check box.
Optional:
Notes:You can also change some other display settings, to see their effect.Under Chart Settings, set Legends to None; On the Data Labels line, select the Series check box, and clear the Percentage check box.
Select the Save current chart settings check box, and click OK.
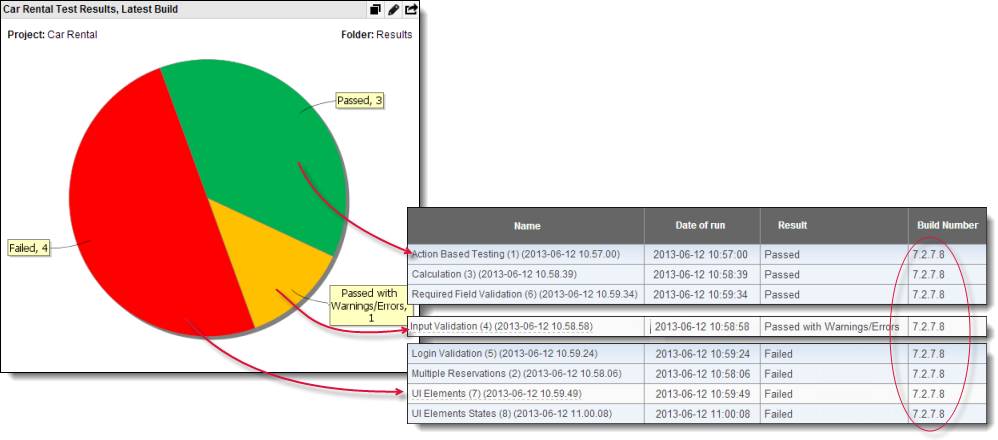
The new chart is displayed which, while based on the same criteria as the previous one, uses a limited set of test results. Drilling down to the individual data records confirms that they are indeed all restricted to a single build:

What you have learned:
- How to restrict the set of data driving a Dashboard panel by means of filtering.
- That filters can be created in either a data profile or a data panel.
- That a filter in a data profile affects all data panels driven by that profile, whereas a panel-based filter is limited to a single panel.
