Starting Dashboard from a browser
You can start the Dashboard from any browser running on a machine with a network connection to the TestArchitect Utility Server.
To start the TestArchitect Dashboard, follow these steps:
Optional: If the TestArchitect Utility Server has not been started, carry out the following steps:
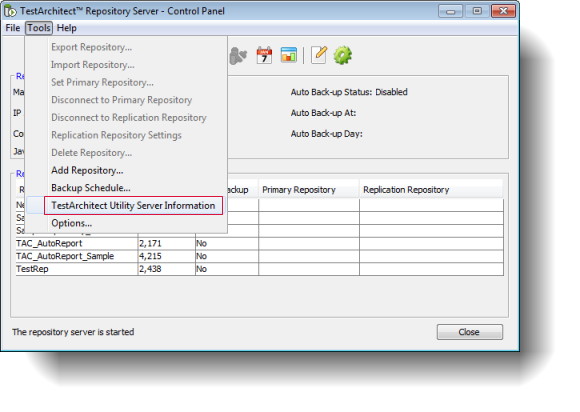
Open the TestArchitect Repository Server - Control Panel by double-clicking on the TestArchitect Repository Server icon on Windows’ notification area.
On the TestArchitect Repository Server - Control Panel main menu, select Tools > TestArchitect Utility Server Information.
 Note:The TestArchitect Utility Server Information command is enabled only after the Repository Server has been started.
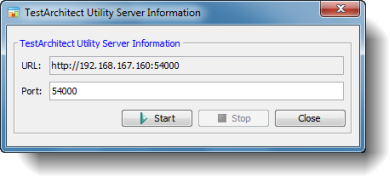
The server information window opens:

If the Start button in the TestArchitect Utility Server Information dialog box is enabled, click it.
Start a browser on a machine with network access to the TestArchitect Utility Server and enter the Dashboard’s URL using the follow syntax:
http://<IP of the TestArchitect Utility Server Information>:<Port number of the TestArchitect Utility Server Information>/TADashboard
http://192.168.167.160:54000/TADashboard
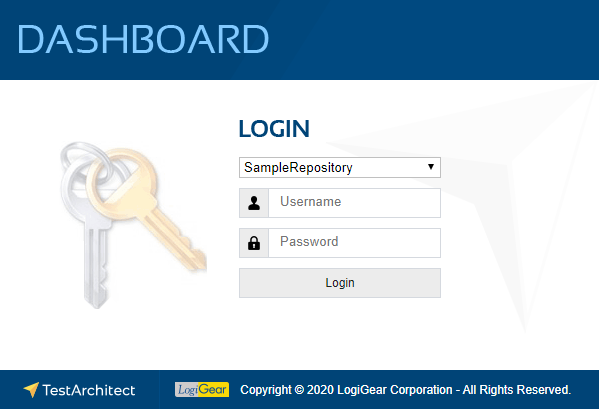
If you are not yet logged in to the Sample Repository, the Dashboard main login page opens in your default browser.

In the TestArchitect Dashboard Login page, select the repository containing the data you are interested in from the Repository Name drop-down box. Enter the username and password for that repository, and then click Login to launch the Dashboard instance.
A Dashboard page appears showing the saved panels for the logged-in user. Depending on your user permission level, you can add, modify, and delete panels on the Dashboard.
Related concepts
Default port numbers and port ranges
Repository Server Control Panel user interface